Page contents
FAQ
Q: How can I use the Dask diagnostics (bokeh) dashboard?
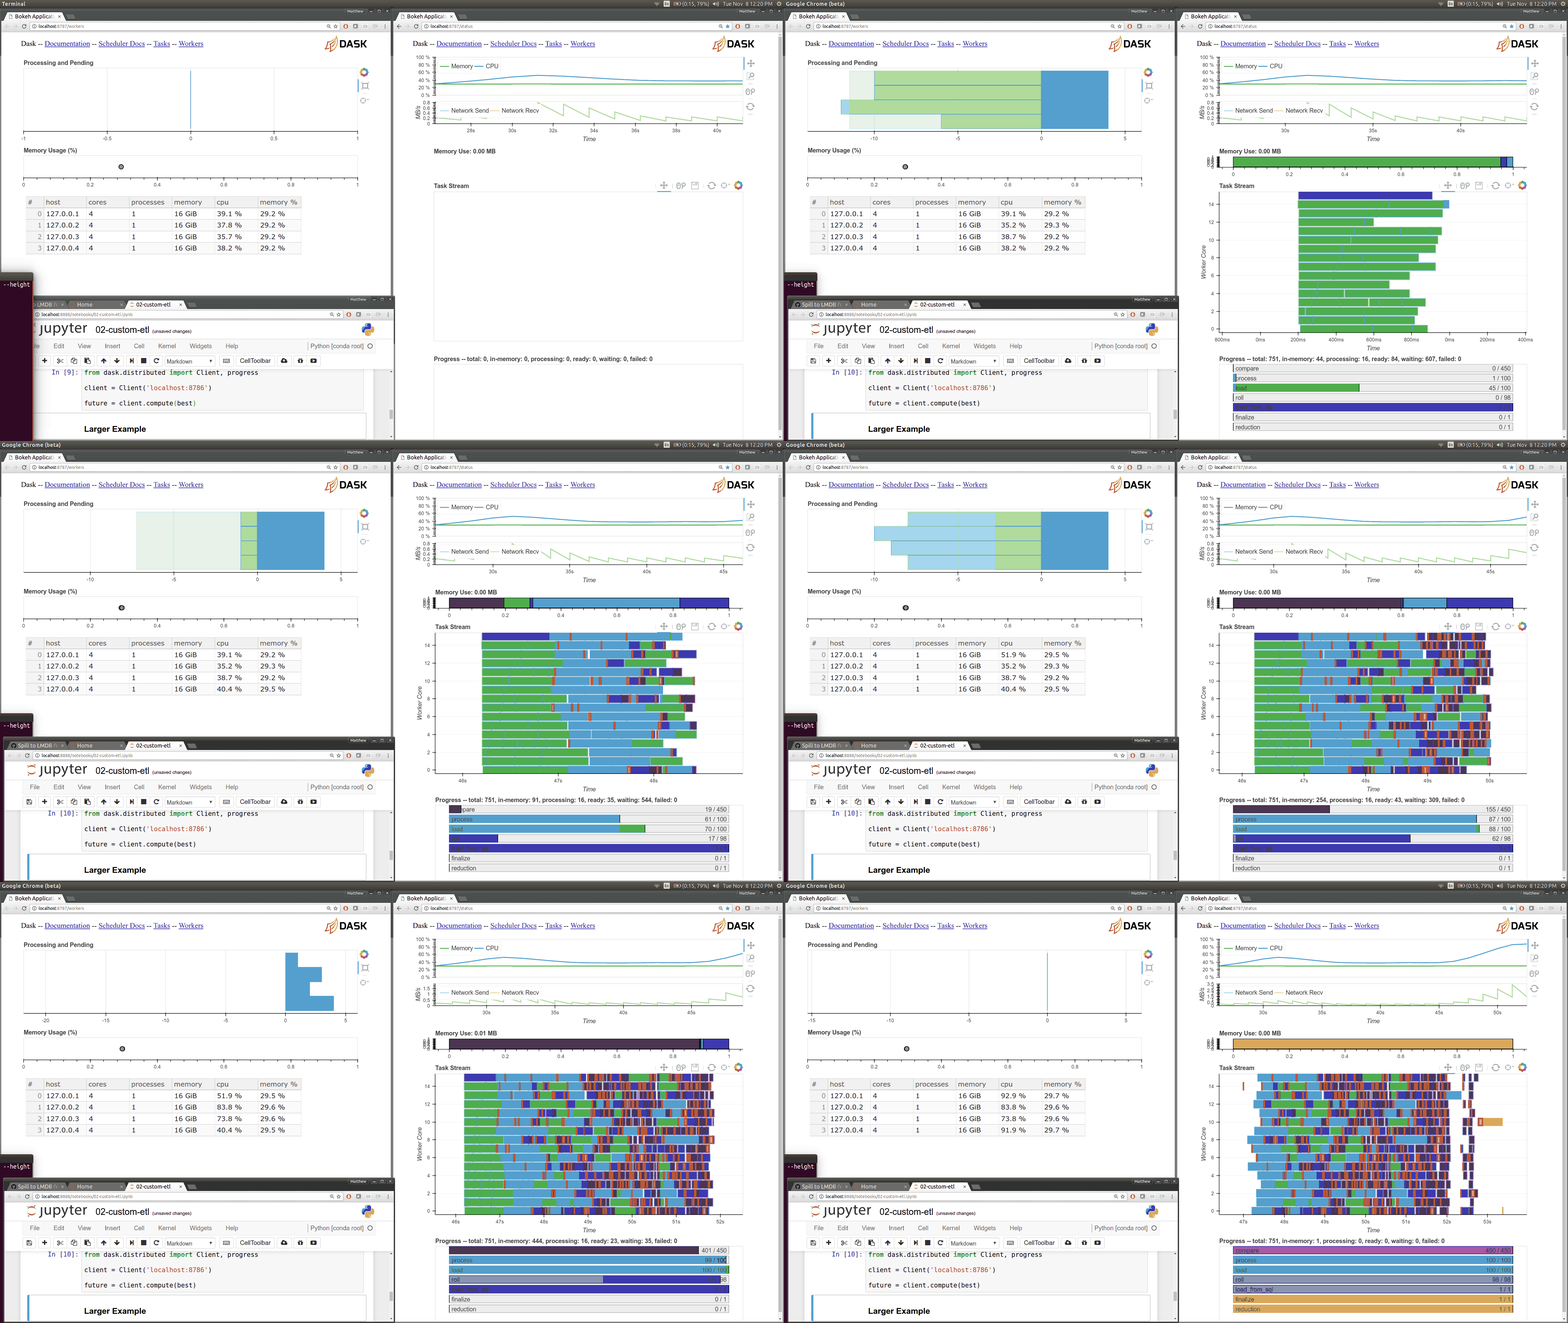
Dask distributed features a nice web interface for monitoring the execution of a Dask computation graph.

By default, when no custom Client is specified, Arboretum creates a LocalCluster instance with the diagnostics dashboard disabled:
...
local_cluster = LocalCluster(diagnostics_port=None)
client = Client(local_cluster)
...
You can easily create a custom LocalCluster, with the dashboard enabled, and pass a custom Client connected to that cluster to the GRN inference algorithm:
local_cluster = LocalCluster()  # diagnostics dashboard is enabled
custom_client = Client(local_cluster)

...

network = grnboost2(expression_data=ex_matrix,
                    tf_names=tf_names,
                    client=custom_client)  # specify the custom client
By default, the dashboard is available on port 8787.
For more information, consult:
- Dask web interface documentation
- Running with a custom Dask Client
Q: My gene expression matrix is transposed, what now?
The Python scikit-learn library expects data in a format where rows represent observations and columns represent features (in our case: genes), for example, see the GradientBoostingRegressor API.
However, in some fields (like single-cell genomics), the default is inversed: the rows represent genes and the columns represent the observations.
In order to maintain an API that is as lean is possible, Arboretum adopts the scikit-learn convention (rows=observations, columns=features). This means that the user is responsible for providing the data in the right shape.
Fortunately, the Pandas and Numpy libraries feature all the necessary functions to preprocess your data.